Introducing Netdata's Demo Space, a quick and easy way to experience monitoring environments before you set them up yourself.

Introducing Netdata's Demo Space, a quick and easy way to experience monitoring environments before you set them up yourself.

Hello, fellow data enthusiasts and Google Colab aficionados! Today, we're going to explore how to monitor your Google Colab instances using Netdata. Colab is a fantastic platform for running Notebooks, developing ML models, and other data science and analytics tasks. But have you ever wondered how your Colab instance is performing under the hood? That's where Netdata comes into play!
Find out how to effectively and easily monitor and troubleshoot BIND 9 using Netdata

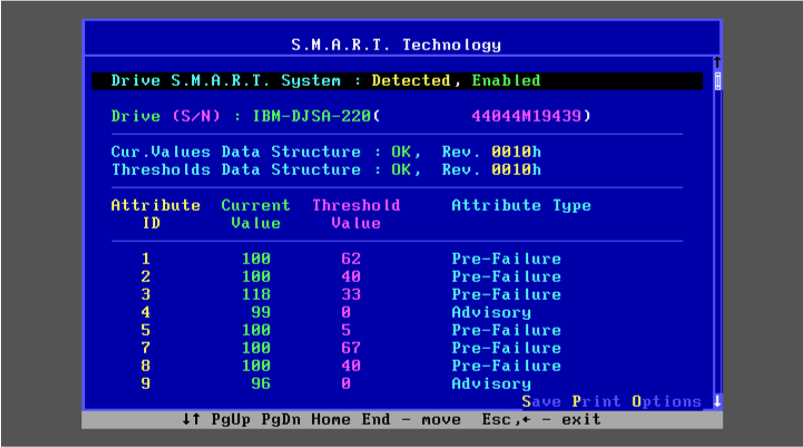
Understand what makes a storage device S.M.A.R.T and how to monitor a self monitoring component using Netdata.
Find out how to effectively and easily monitor and troubleshoot Memcached using Netdata

Find out how to effectively and easily monitor and troubleshoot NTPdaemon using Netdata

Find out how to effectively and easily monitor and troubleshoot MongoDB using Netdata


Find out how to effectively and easily monitor and troubleshoot Dovecot using Netdata
![]()
Find out how to effectively and easily monitor and troubleshoot CoreDNS using Netdata

Find out how to effectively and easily monitor and troubleshoot Dnsmasq for DHCP using Netdata

Find out how to effectively and easily monitor and troubleshoot Dnsmasq DNS Forwarder using Netdata

Find out how to effectively and easily monitor and troubleshoot systemd-logind using Netdata

Find out how to effectively and easily monitor and troubleshoot Postfix using Netdata

Find out how to effectively and easily monitor and troubleshoot Chrony using Netdata

Find out how to monitor your Internet speed and quality and how well your ISP is performing.

FreeBSD is a high-quality, stable, and secure operating system used in a wide variety of applications, and we want to show you how monitor FreeBSD systems painlessly and effectively.

Monitoring the health and status of nodes and servers is a critical part of effective infrastructure monitoring.

Use Netdata to effectively monitor and troubleshoot the performance of NVMe (Non-Volatile Memory express) disks in your infrastructure. Preempt disk failures and take action to ensure your systems run without a glitch.

Best practices for Apache server monitoring and troubleshooting.

Web servers are among the most important components in modern IT infrastructures. They host the websites, web services, and web applications that we use on a daily basis. Social networking, media streaming, software as a service (SaaS), and other activities wouldn’t be possible without the use of web servers. And with the advent of cloud computing and the movement of more services online, web servers and their monitoring are only becoming more important. Given the extensive usage of Web servers, Sysadmins and SREs should monitor web servers as a key aspect for performance.

Monitoring indoor air quality with Airthings and Netdata. Understanding and measuring common contaminants and pollutants reduces your risk of air quality health concerns.
How to monitor and troubleshoot Cassandra with Netdata.

Database bloat is disk space that was used by a table or index and is available for reuse by the database but has not been reclaimed. Bloat is created when deleting or updating tables and indexes. Here's how to deal with it!
What are the important Cassandra metrics to monitor and how to monitor them.
We often hear the term load used to describe the state of a server or a device, but we're here to tell you what it means, precisely, and how to monitor it.
The most important part of disk usage monitoring is to check the utilization of each filesystem and each mount point which can reveal existing or impending issues with the storage space on your infrastructure.
Redis is designed to be fast. In most cases, it is. However, there are times when Redis may be slow, due to network issues, disk latency, or other factors. When this happens, it is important to be able to detect the slow down and investigate the cause of Redis latency.

The life of a sysadmin or SRE is often difficult, but occasionally very simple things can make a huge difference. Basic monitoring of your systemd services is one of those simple things, which we sometimes overlook. The simplest question one would want to know is if the thing that’s supposed to be running is actually running at all. If you use systemd services, you can guarantee an answer to that question within minutes using Netdata.
The HTTP protocol has become the de facto standard application layer protocol of the internet. From publicly available web sites and APIs to “inter-process” communications in REST based microservice architectures or large Service Oriented Architectures based on SOAP, you find HTTP being used again and again, due to its simplicity and our familiarity with it. How many protocols can you name that have memes for their status codes? Of course, such a popular protocol has endless pages written about how to properly monitor the services that rely on it, with many options specific to every use case.
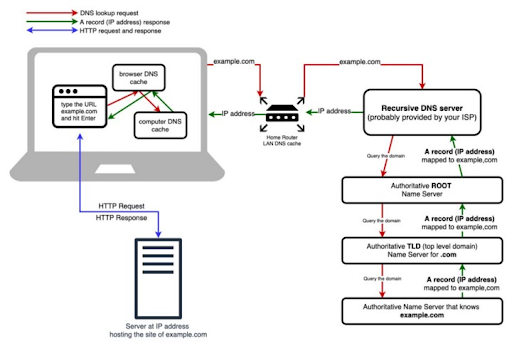
DNS (Domain Name System) servers translate standard language web addresses to their actual IP addresses for network access.

High availability. This is what every monitoring tool needs to ensure that you never compromise on IT infrastructure visibility.
Most sysadmins and developers have at some point used a few of the popular Linux networking commands or their Windows equivalents to answer the common questions of host reachability - that is, whether a host or service is reachable and how fast it responds.
It is sometimes easy to get lost in the mountain of metrics and infinite number of dimensions when working with an infrastructure monitoring tool. Being able to filter metrics by label and visualize only what is relevant to the current scope of monitoring &troubleshooting, becomes absolutely crucial to the success of SREs, Sysadmins and DevOps professionals.
While working on improving the Netdata PostgreSQL collector, we were monitoring our production PostgreSQL instance and something caught our attention immediately. The rows fetched ratio seemed really, really low for one particular database... there were missing indexes in PostgreSQL!
![]()
![]()